
7PH Graph: A Knowledge Graph of a Competitive Metagame
Published:
Links (start here)
- Live explorer: www.7phgraph.com
- GitHub repo: 7ph-graph
- Domain language: CONTEXT.md
- Architecture decision records: docs/adr/
Overview
Competitive Magic: The Gathering formats generate a rich relational record: who played what, at which event, alongside which cards, finishing where. Tabular stats sites answer aggregate questions well (“what is the most played card?”) and relational ones badly (“which decks does this card actually travel with, and did that change?”).
7PH Graph models the Australian 7 Point Highlander metagame as a property graph, linking events, pilots, decks and cards down to card attributes (type, mana value, colours, point cost, Reserved List status), and puts an interactive explorer over it. The current artifact covers 107 events, 1,083 pilots, 4,591 decks and 4,995 distinct cards across 2023 to 2026.
The interesting part is not the graph. It is what the project does with uncertainty: the source data is incomplete and occasionally self-contradictory, so every value the build decides rather than reads carries the name of the rule that decided it, and several surfaces refuse to draw rather than draw something the evidence cannot support.
What it does
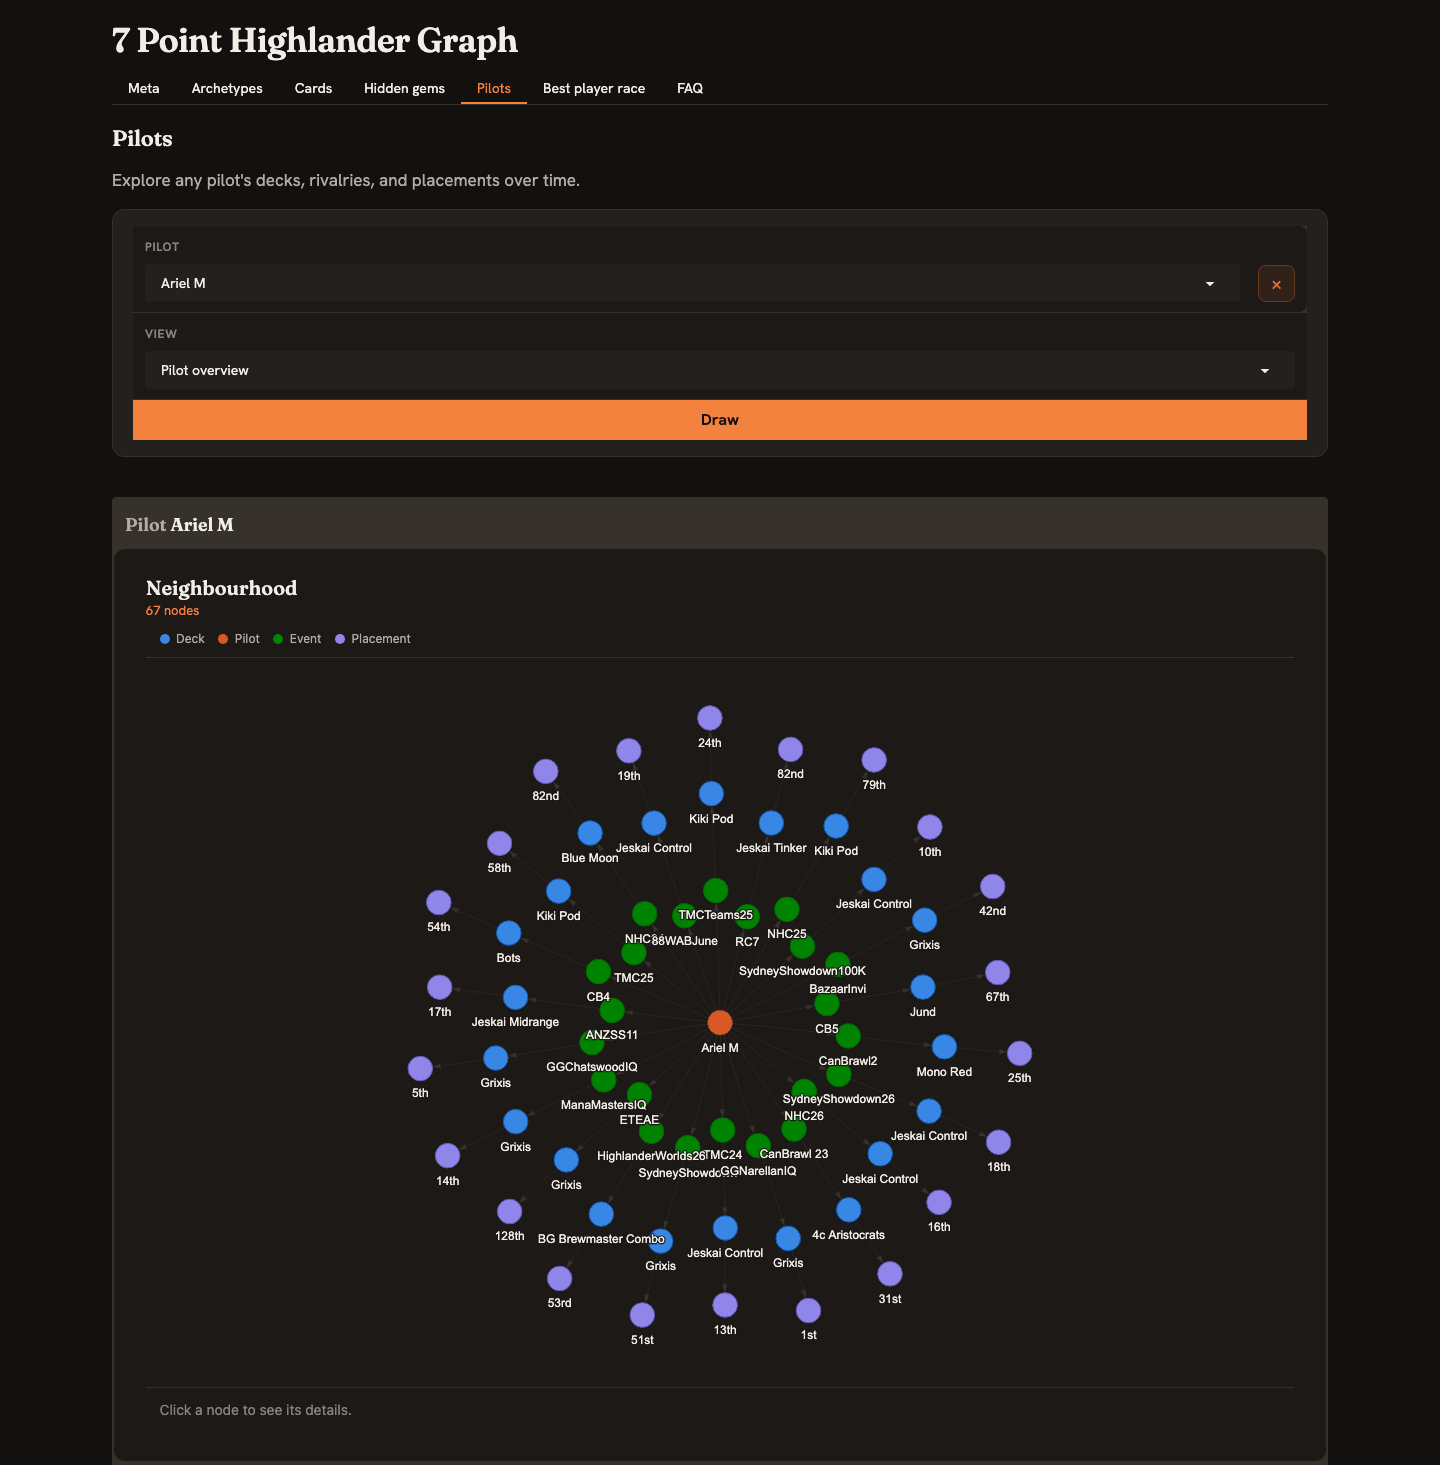
- Draws a subject’s neighbourhood. Pick a pilot or a card, pick a view, and the app returns an interactive graph: a pilot’s decks, events and placements; a card’s usage across archetypes; the cards a pair is played alongside. Clicking a node opens its details, and a deck links out to Moxfield.
- Compares two subjects head to head, over the events they both attended, and refuses when there are none.
- Surfaces hidden gems, cards that are rare inside an archetype yet keep turning up in its best decks. This is the one view with nothing to pick: it draws the whole format at once and recalculates as decks arrive.
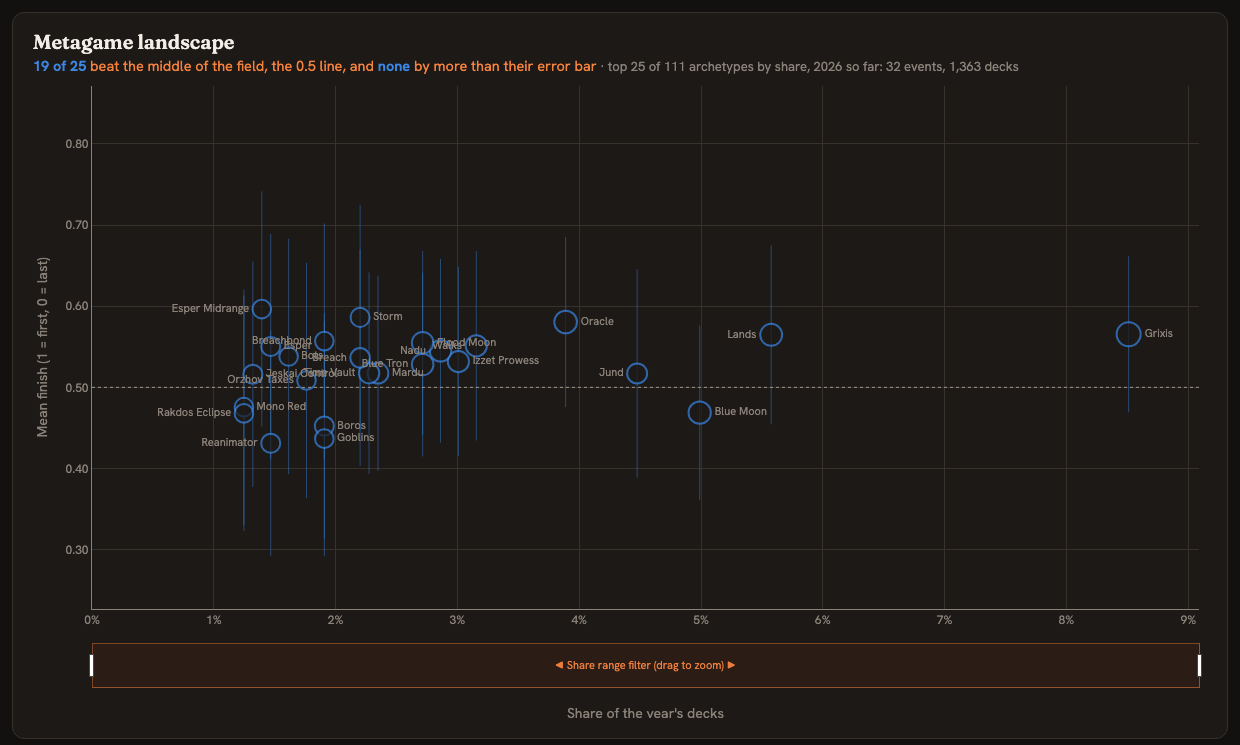
- Charts the metagame over time: archetype share against mean finish with error bars, adoption curves per card, and a player leaderboard with an honest interval on every rank.
Refusals, not guesses
A result too large to read is neither drawn nor silently truncated. The app reports the node-kind distribution of what the query matched and asks you to narrow it, because a truncated graph looks like an answer and is not one. The same rule governs a pilot with too little history to average, and a pair who never met.
The statistical surfaces work the same way. An earlier version of the leaderboard plotted each contender’s form as a rolling window, and the shape was tested before it shipped: permuting each pilot’s own finishes across their own event dates destroys any trace of when they played well while preserving how well they played. Observed movement was 0.0915 against a shuffled 0.0885 (90% range 0.0823 to 0.0947). The chart was drawing sampling noise and calling it form, so it was replaced with a running score. A bootstrap on the standings said the rest: only 4.9 of the top 8 survive a resample, and rank 7’s honest interval runs from 1 to 40. The tab was renamed from “Best player race” to “Player leaderboard” because the old title asserted precisely what the evidence refused.
How it works
Three commands, and only the first two talk upstream:
graph7ph fetch   # download source data into snapshots/<timestamp>/
graph7ph build   # load the accumulated snapshots into a graph artifact
graph7ph app     # serve the explorer over the prebuilt artifact
Ingestion is append-only and gated. Each fetch is kept as an immutable snapshot, and the build folds the whole sequence: every snapshot is validated against the accumulated union of all snapshots before it, not just the previous one, so a rewrite buried in an interior snapshot is caught instead of collapsing into the prior union. A new artifact is promoted only if it validates, with the previous one retained for instant rollback. A build that finds dropped ids or changed historical facts holds the fact at its pre-change value and reports it: the flag is an action for a human, not a notice.
The app never fetches or builds. It opens a promoted artifact read-only, which is what lets the deployed instance carry no upstream credential at all.
Key engineering decisions
Every decided value names its rule. The source ships placements it never normalised, event field sizes contradicted by its own deck counts, and finishes recorded only as a tie band. Rather than a boolean “estimated” flag, each uncertain value has a companion column holding a rule name (placementImputed, normImputed, fieldImputed): null where the source’s own number stands, a rule name where a pass here produced it, and none where a rule was looked for and none fit. “Which of this deck’s numbers did we decide, and under what rule?” is then one query, including for classes of uncertainty not yet invented. This mattered: 28 decks held a known placement with no norm, and since every metric reads the norm, they fell out of every ranked average. They were not a random sample either. 27 of the 28 were top-8 finishes, so the bias ran in one direction and hit hardest the pilots who made the cut.
A share as a ceiling, a count as a floor. The hidden-gem definition looks symmetric and is not. “Is this still rare?” is meaningless except relative to the slice it sits in, so the ceiling is a share. “Do we have enough decks to believe it?” is a property of sample size and does not scale with the meta, so the floor is a fixed count. Making both relative fails in both directions at once: a 1% floor is 45 decks globally (the whole-meta view collapses to 4 cards) and 1.06 decks inside a small archetype (admitting exactly the lucky-draw noise the floor exists to reject).
The graph store was replaced under the project. The original store, Kùzu, was archived by its vendor with no successor. The migration to Ladybug (the active MIT fork) was graded against a recorded oracle rather than a reading of the diff: baseline/subgraphs.json captures what every query entry point answers, plus table counts and dropdown catalogues, and the baseline command exits non-zero on any difference and refuses to overwrite itself without a force flag.
The visual layer is tested by a browser, not by assertion. A Playwright suite measures what the graph document actually paints at desktop width. A separate acceptance script drives the real app through every tab and state at phone and desktop widths, photographs each one, and walks every rendered text node (page, Plotly SVG chrome, and the graph document inside its iframe) measuring it against the background it is actually painted on for a WCAG AA contrast pass.
Deployment
A Hugging Face Space with protected visibility (the repository stays private, the running app stays reachable) behind a custom domain at www.7phgraph.com. Protected rather than public because the deployed bundle carries the built graph and the ingestion reports, and a public Space offers both for download.
Stack
Python 3.11+ · Ladybug (embedded Cypher graph store) · Gradio · Plotly · pyvis · Pydantic · pytest · Playwright · uv · Hugging Face Spaces
The repo carries 24 architecture decision records, a domain glossary that defines the language the code and the UI both speak, and a test suite slightly larger than the source it covers.
Attribution
Metagame data comes from 7phstats; decklists link out to Moxfield. Free and non-commercial, per Moxfield’s API terms. Unofficial, and not affiliated with either service or with Wizards of the Coast.